A place to start
A location view provides context for planning. An individual building still needs its own measurements and observation period.
Radon map
Select a sample point to see how a room record connects a place, an observation period and an instrument.
Sample room average · 32 Bq/m³
Illustrative locations and data for this portfolio.A location view provides context for planning. An individual building still needs its own measurements and observation period.
A useful location record includes the date, instrument position and the units attached to the reading.
Compare records with the same period and explain differences in placement, building use or completeness.
Choose a representative position in the space you want to understand. Keep the setup date and location with the instrument history. A record from another property or another room supplies context for planning. Review the measurements for the actual location before making a decision.
The three locations are illustrative. They demonstrate the website map interaction and contain sample readings.
Each measurement belongs to its own position and observation period. Keep those details when reviewing or comparing records.
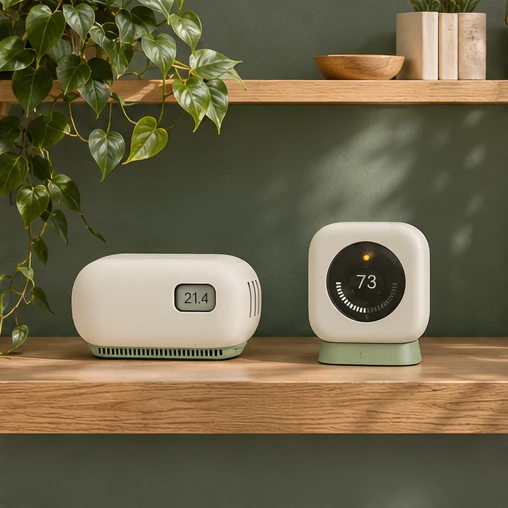
The comparison page shows the dedicated Sile Radon reader and the wider Forma Seven room monitor.
Business inquiries
Choose your models and quantities, then tell us about the spaces, destination and timing.